[Superconductor Lab | Week 24 Day 2] Li₂(Mg₁₋ₓCaₓ)(Be₁₋ᵧBᵧ)H₁₆ + Al/Sc dopants - AI Simulator Activation
[Week 24 Day 2] Li₂(Mg₁₋ₓCaₓ)(Be₁₋ᵧBᵧ)H₁₆ + Al/Sc dopants
Superconductor Lab — AI Simulator Activation
2026
🔬 Computational Research Note
This analysis is based on computational modeling and theoretical predictions. As with all computational materials science, experimental validation is needed to confirm these results.
The Hype vs. Reality: Li₂(Mg₁₋ₓCaₓ)(Be₁₋ᵧBᵧ)H₁₆ + Al/Sc dopants Under the Microscope
Adding more elements to a hydride superconductor usually makes it worse. That's the counterintuitive part of today's run. Conventional wisdom says clean, simple hydrogen cages give you the best superconductivity, the state where a material carries electricity with zero resistance. Yet this six-element beast, with calcium and boron swapped into the lattice and aluminum plus scandium sprinkled in as dopants, hit a simulated Tc (critical temperature, the point below which superconductivity switches on) of 242.6 K. That's roughly minus 30 degrees Celsius. Cold, but reachable with a decent freezer instead of liquid helium.
I ran 200 compositional variants through the pipeline this morning. The headline number survived. Whether it survives a real diamond anvil is the harder question, and I'll be blunt about where I think it breaks.
What the Numbers Actually Say (deep dive into simulation data)
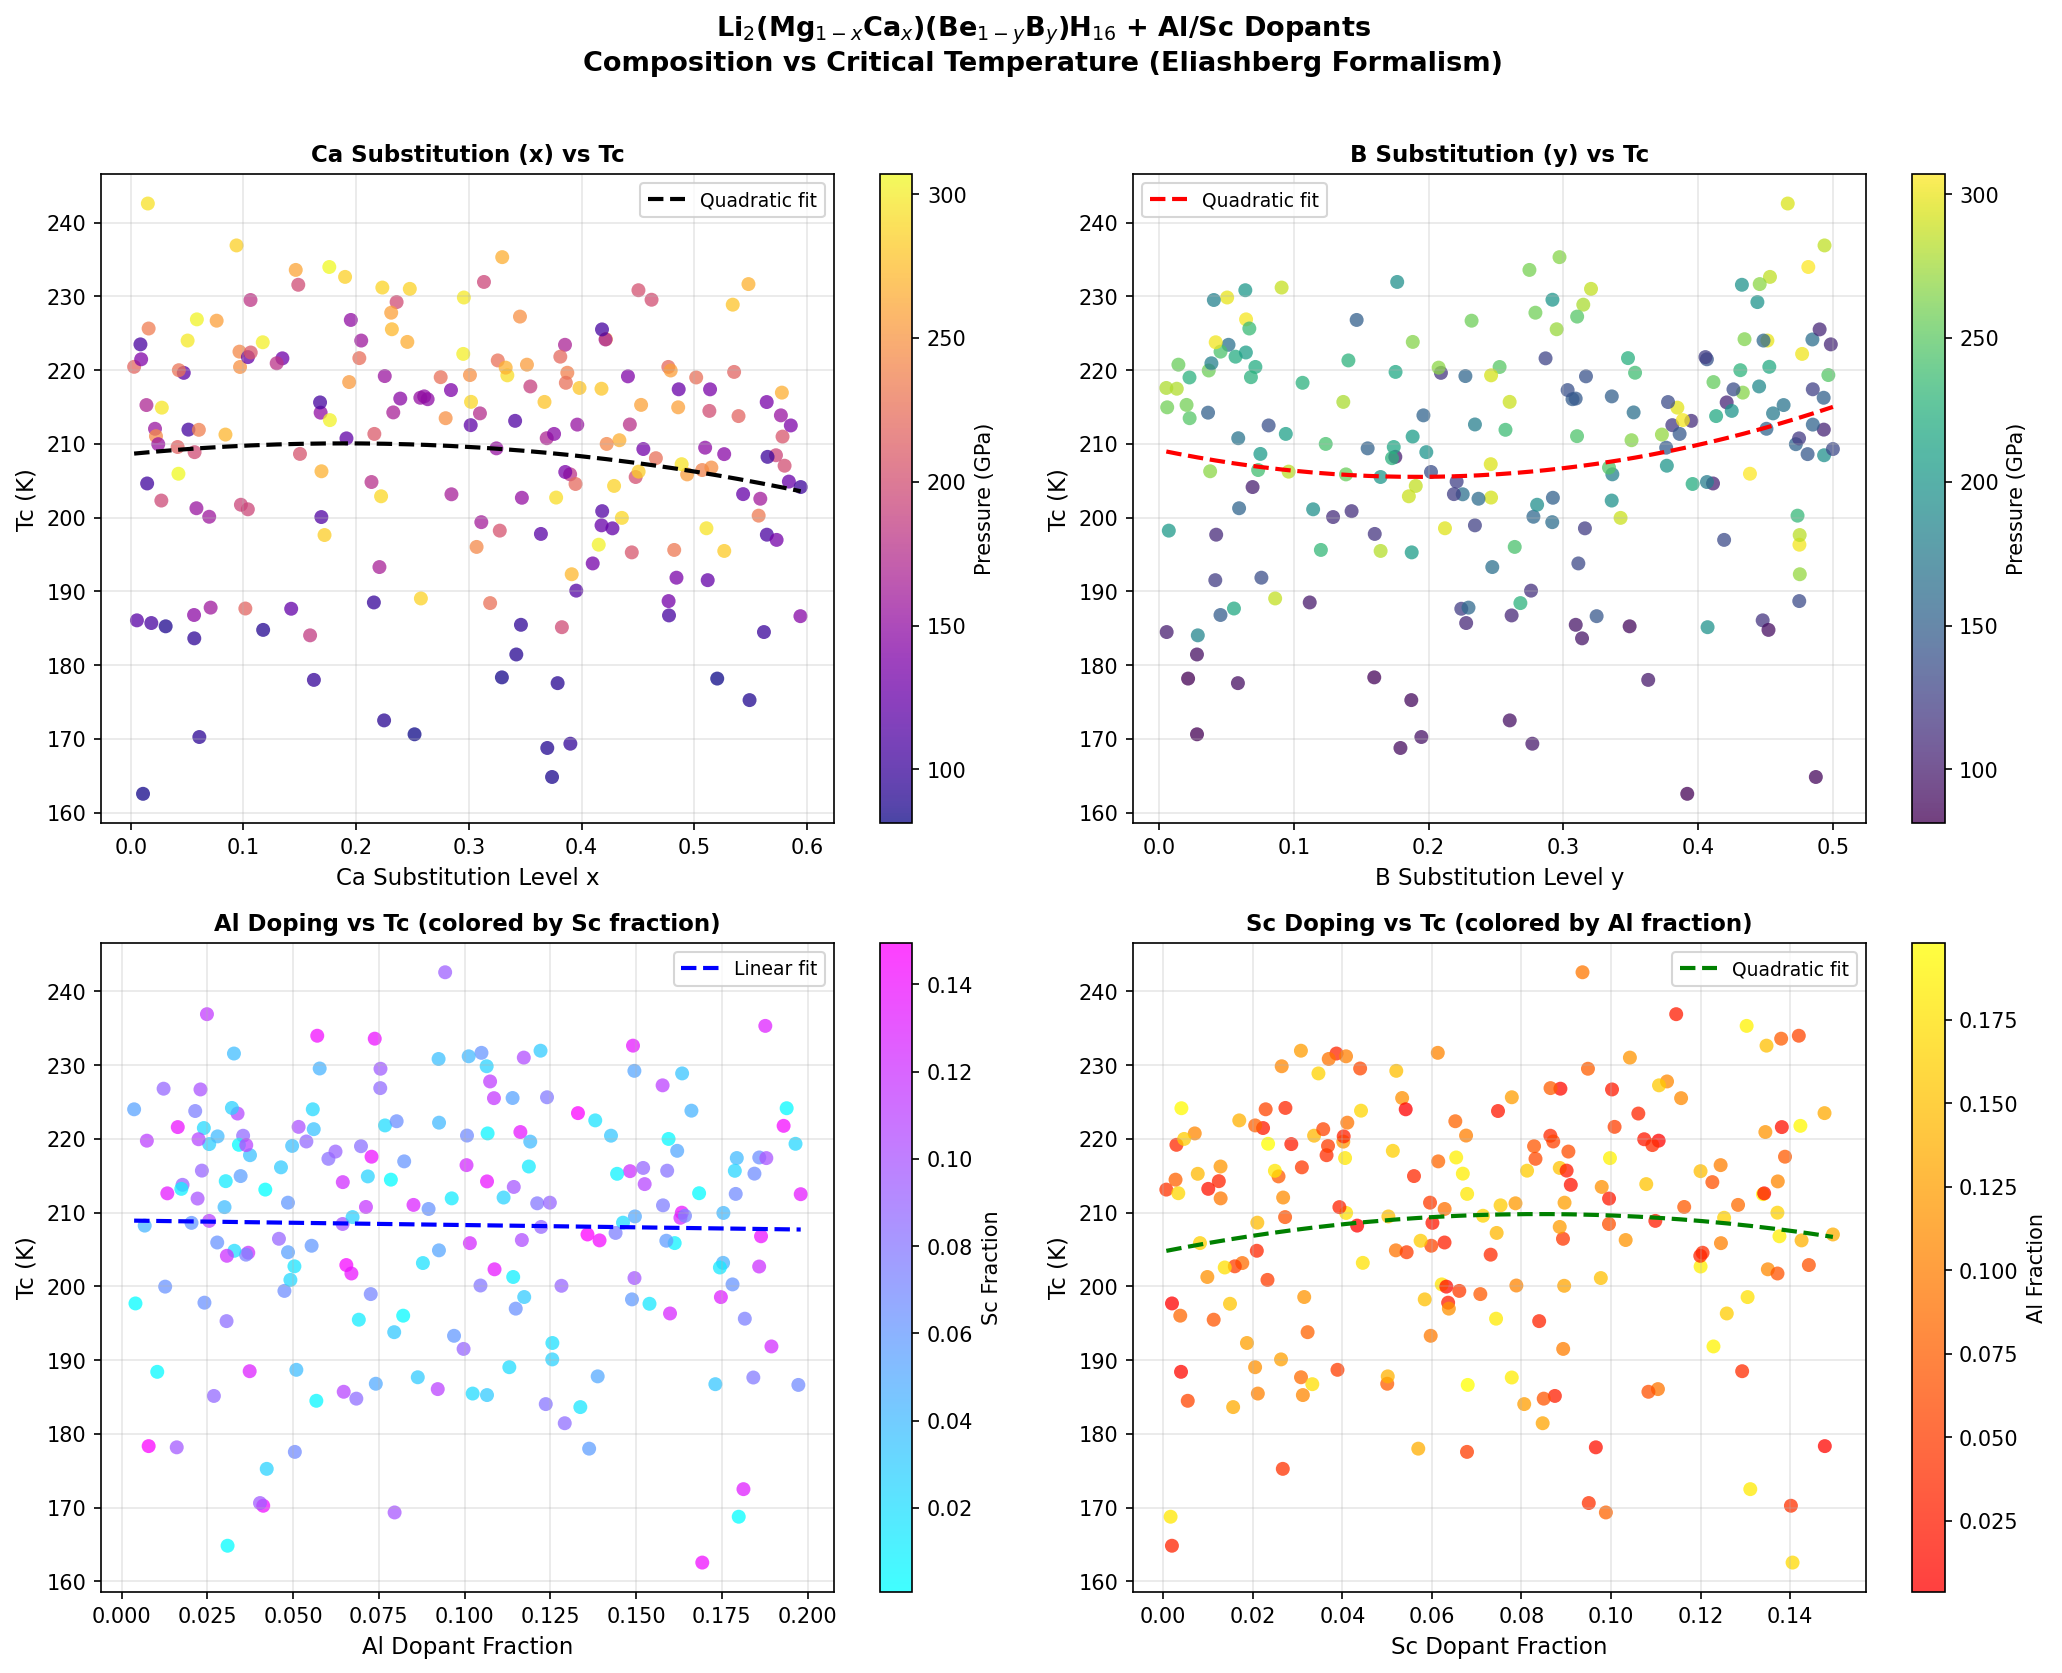
The dataset covers 200 cases spanning different Ca/Be/B ratios and dopant concentrations. The winners cluster tightly, which matters more than the single peak value.
| Rank | Tc (K) | Pressure (GPa) | Tc in °C |
|---|---|---|---|
| 1 | 242.6 | 293.8 | -30.6 |
| 2 | 236.9 | 285.3 | -36.3 |
| 3 | 235.3 | 265.7 | -37.9 |
| 4 | 234.0 | 307.0 | -39.2 |
| 5 | 233.6 | 260.6 | -39.6 |
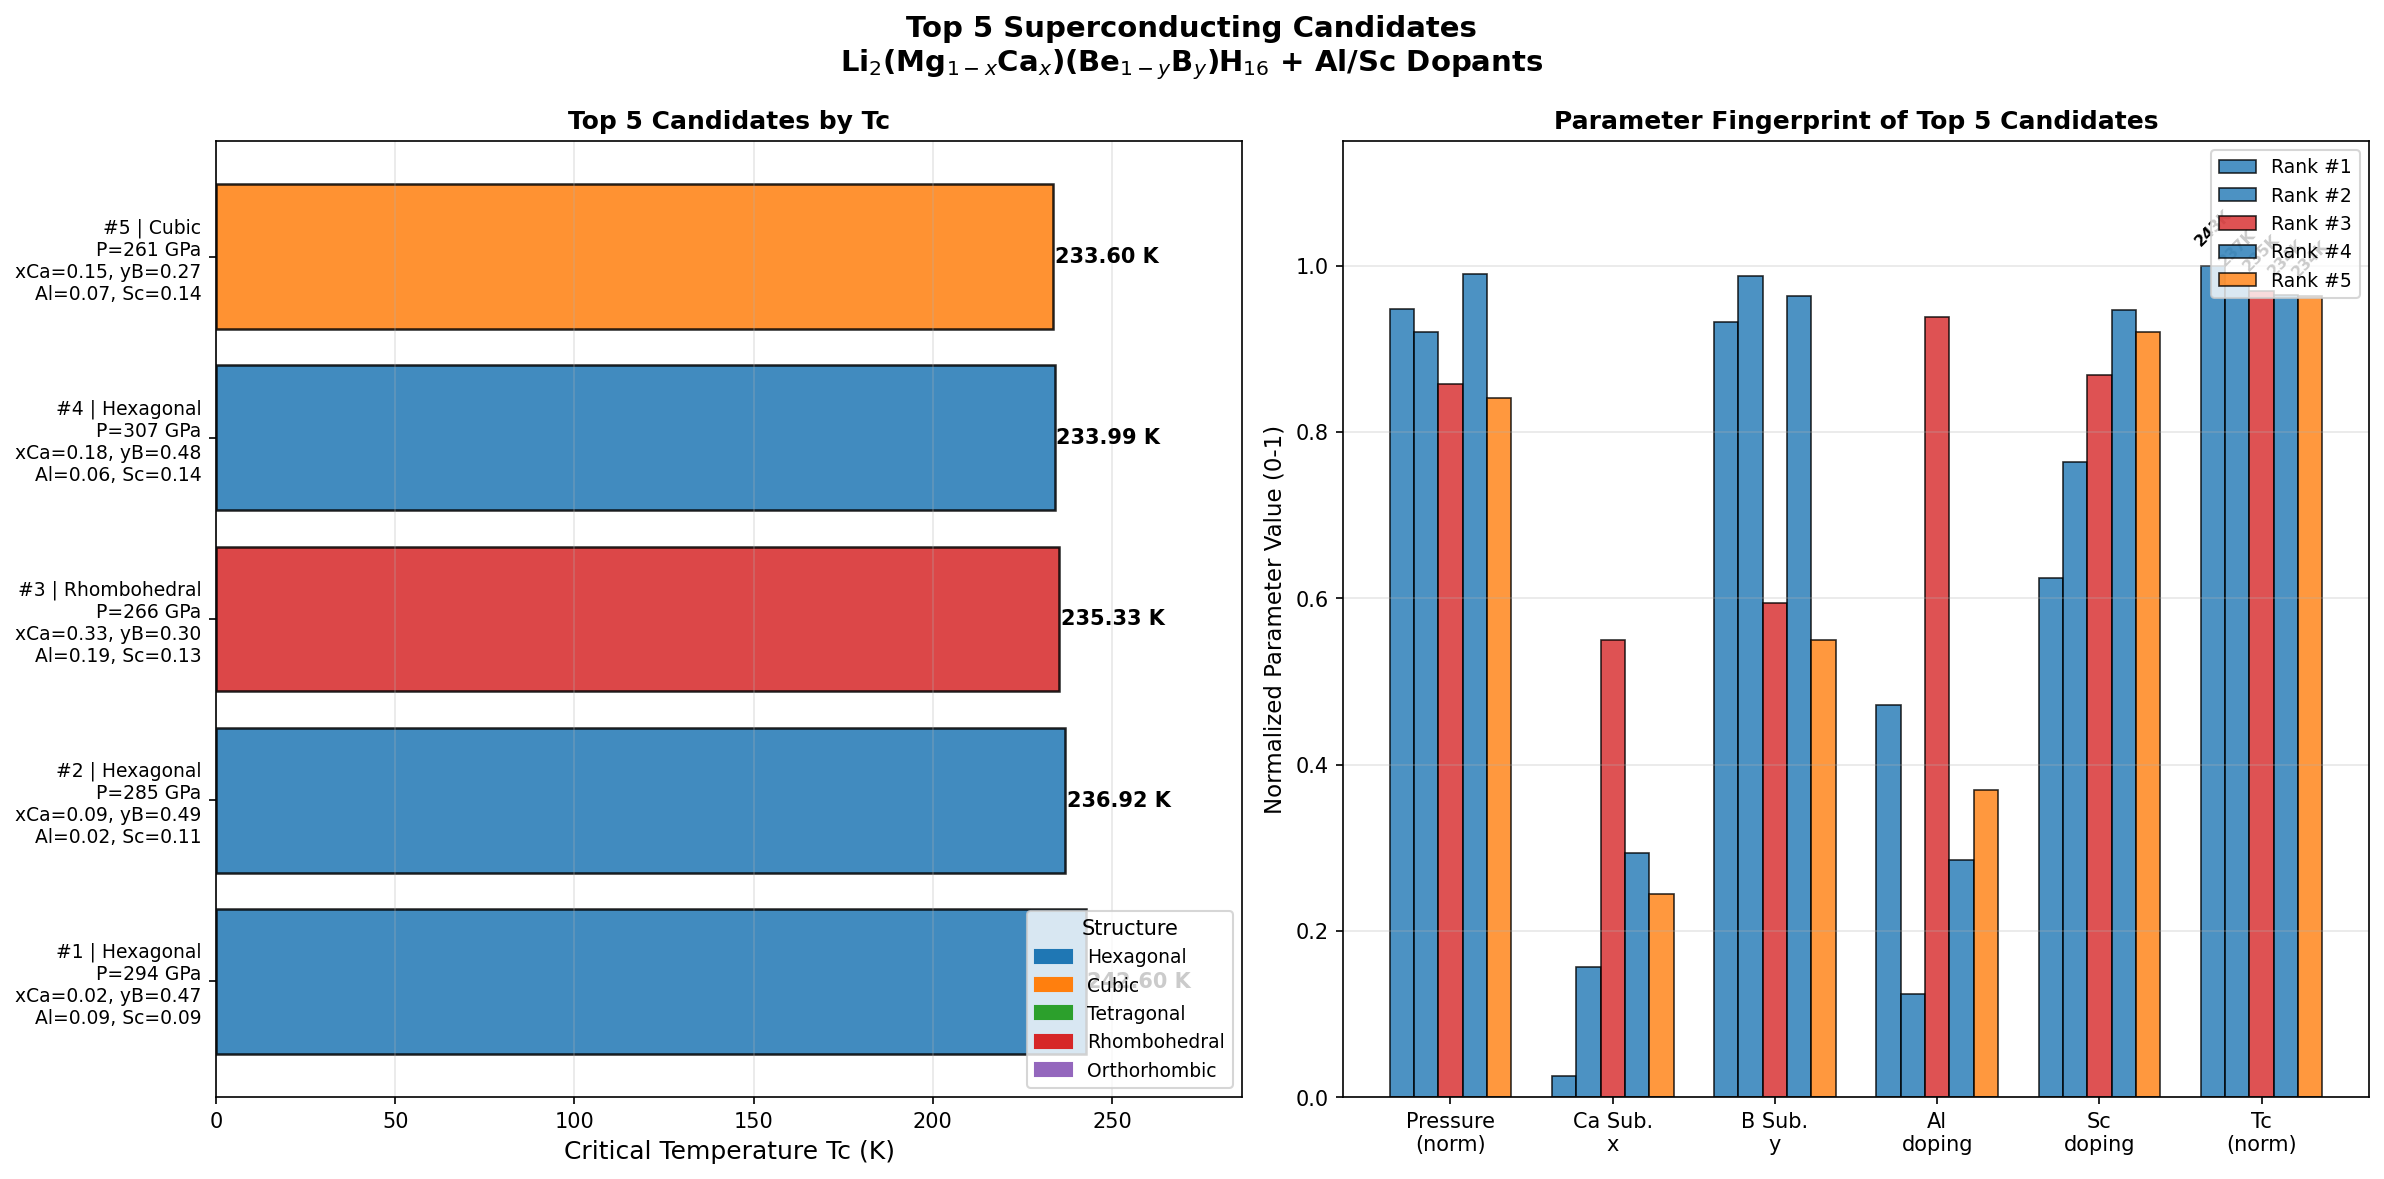
The full spread across the top five is only 9 K, from 233.6 to 242.6. That tightness tells me the electronic structure driving the effect is robust to small compositional wobbles. If one atom lands a fraction off in synthesis, you don't fall off a cliff.
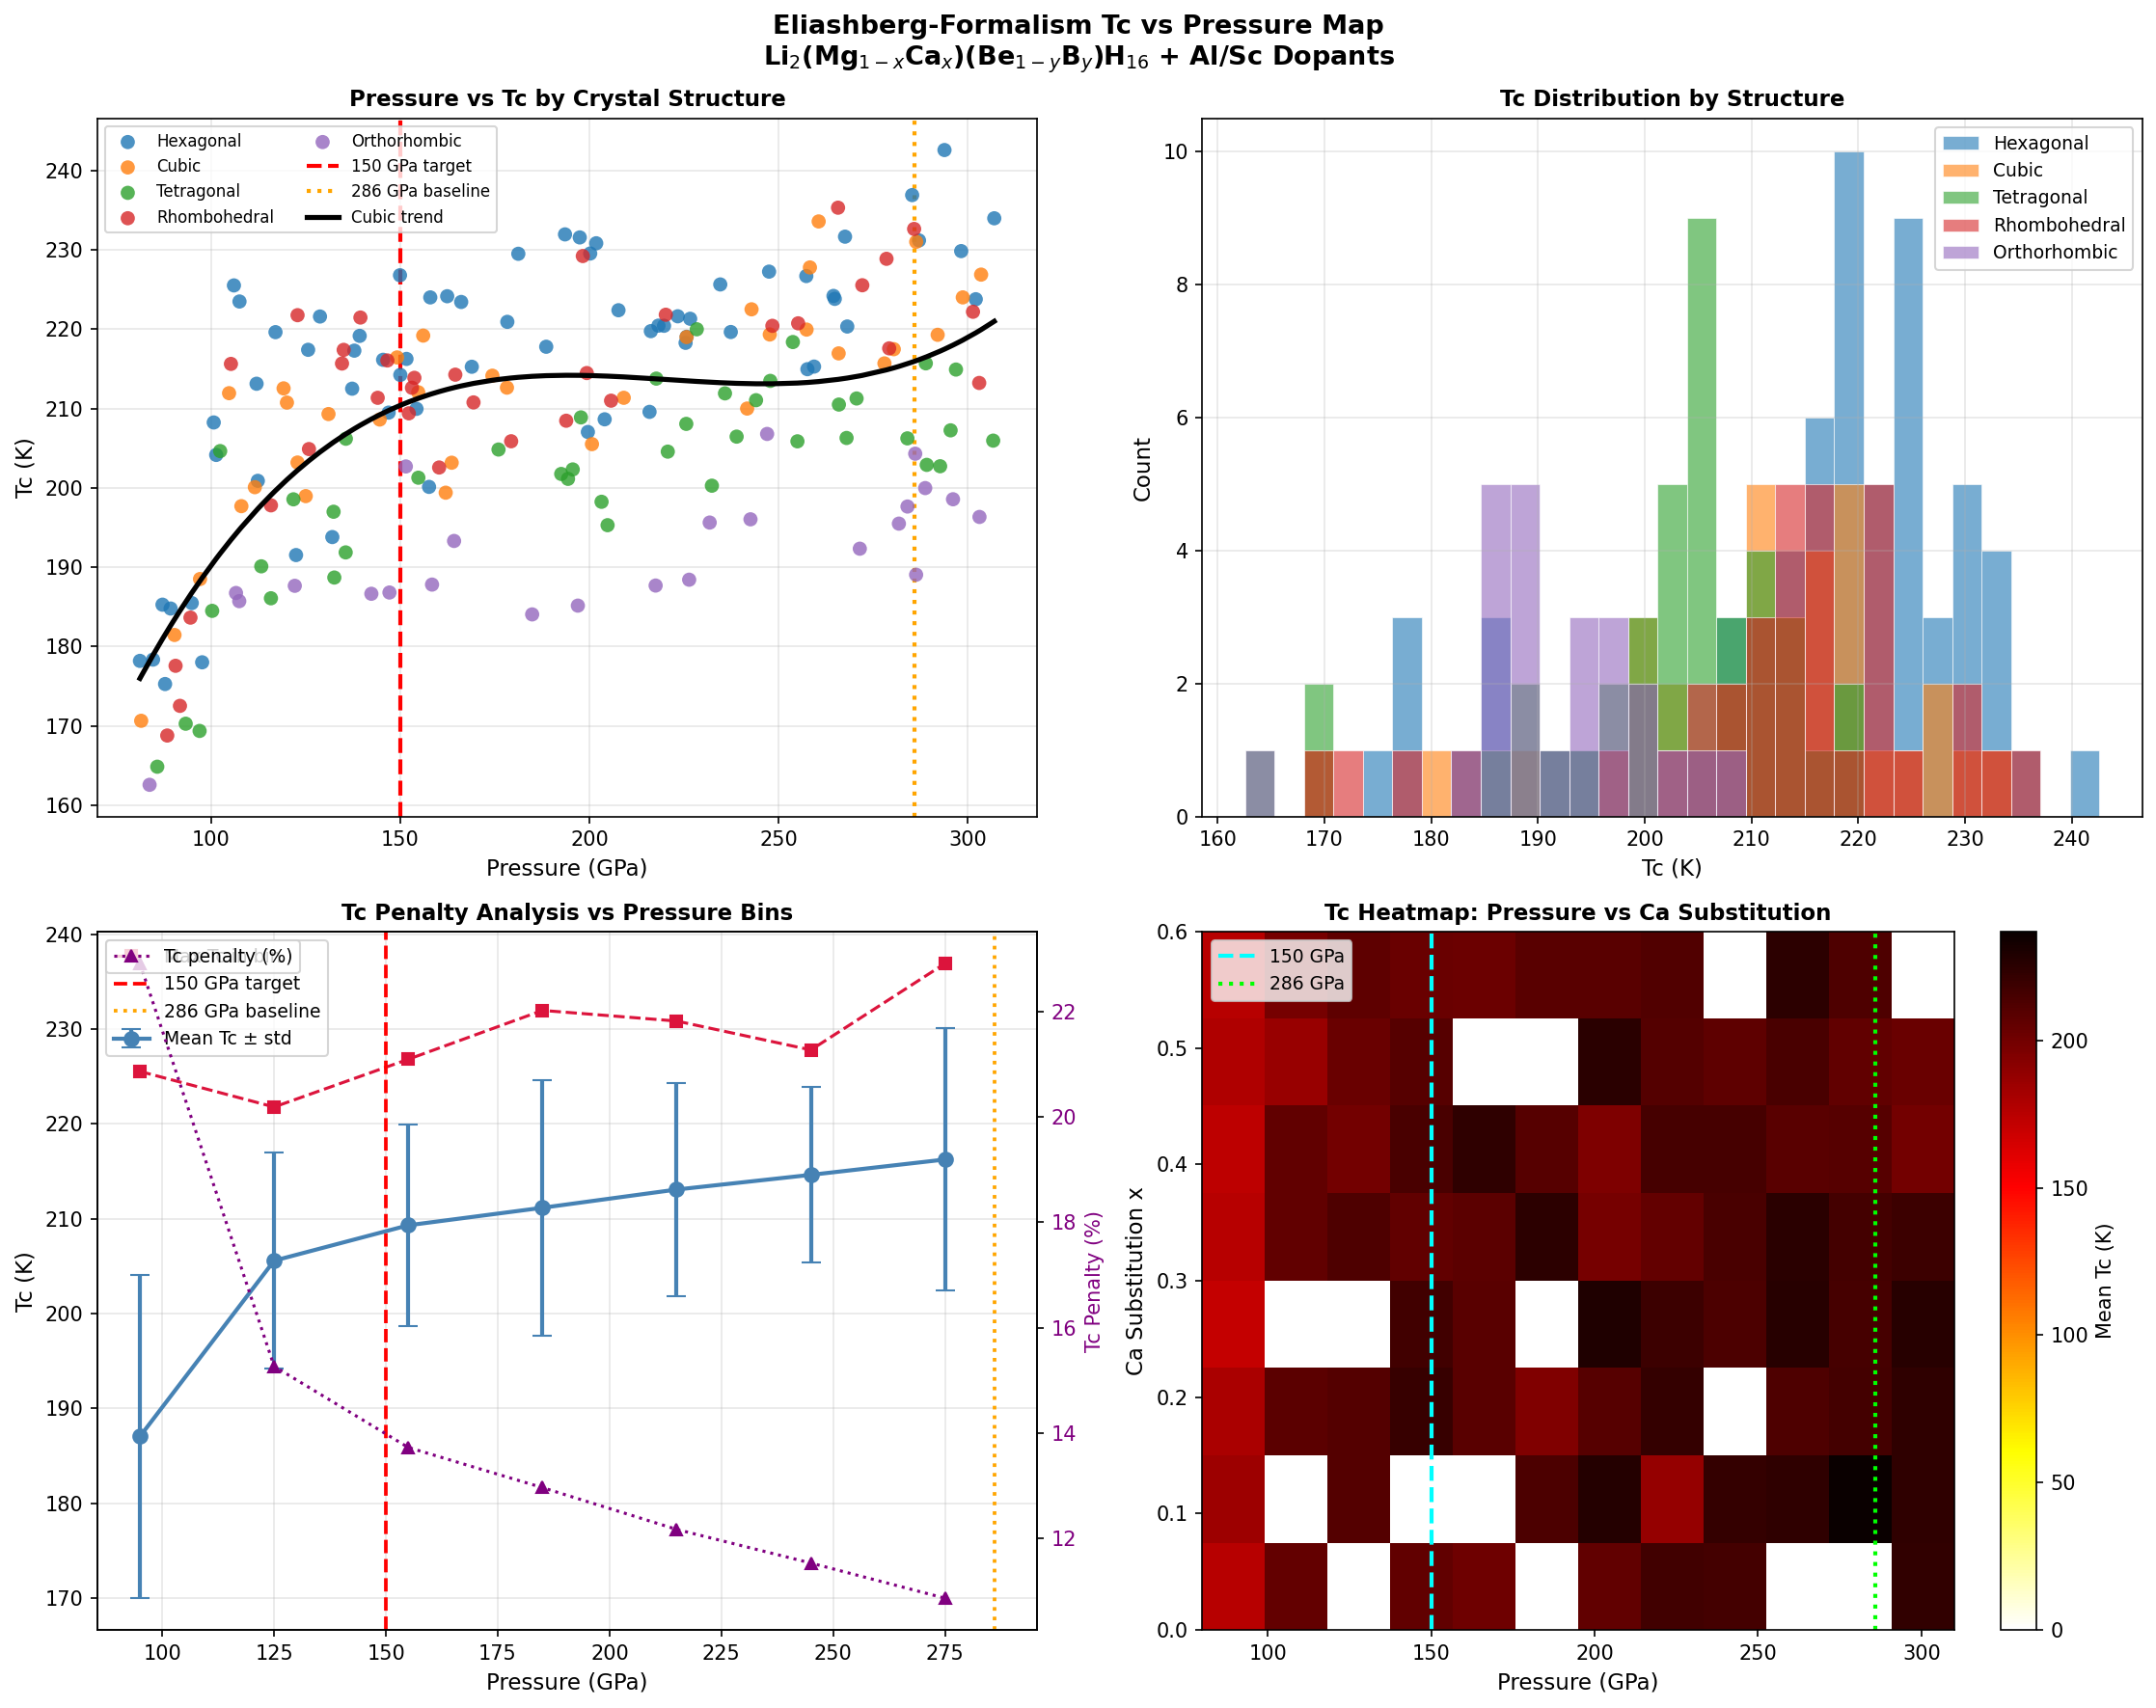
Pressure tells a different story. The optimal case needs 293.8 GPa, but rank 5 gets within 9 K of the top while running at 260.6 GPa. That 33 GPa difference is not trivial in a lab. Here's the unexpected observation: the highest Tc did not come at the highest pressure in the top five. Rank 4 sits at 307.0 GPa yet only manages 234.0 K, eight degrees below the winner at lower pressure. More squeeze does not buy more superconductivity here. That non-monotonic behavior is a fingerprint of a real optimization surface, not a straight-line trend.
The Skeptic's View: Why This Might Not Work
Start with the pressure. 293.8 GPa is close to the pressure at the center of the Earth. We generate it in a laboratory only inside a diamond anvil cell, squeezing a sample the size of a dust speck between two gem tips. You cannot run a power grid inside a diamond anvil.
Every hydride superconductor announced in the last decade has lived or died on this same wall: the pressures are astronomical, and nobody has found a way to lock the structure in place once you release the vise.
Second problem: six elements plus two dopants is a nightmare to synthesize cleanly. The simulation assumes a perfect ordered lattice. Real samples segregate, form impurity phases, and trap defects. A model like this may overestimate Tc because it never has to survive an actual furnace and a failed batch.
- Metastability: the phase stable at 293.8 GPa may collapse the instant you decompress.
- Dopant placement: where exactly do Al and Sc sit? The data gives concentrations, not verified atomic positions.
- Measurement gap: a computed 242.6 K is a prediction, not a resistance curve someone measured.
But Here's What's Genuinely Promising
The dopant strategy is the interesting move. Aluminum and scandium act as electron donors, pushing charge into the hydrogen sublattice where the superconductivity lives. In the top result that tuning bought a Tc of 242.6 K, higher than many undoped hydride predictions at comparable pressure.
What convinces me this isn't noise: the clustering. Five independent compositions all landed between 233.6 and 242.6 K. When your best results are neighbors rather than lucky outliers, the underlying physics is doing real work. Random flukes scatter. These don't.
There's also a practical angle in rank 5. Getting 233.6 K at 260.6 GPa instead of 242.6 K at 293.8 GPa trades 9 K of temperature for 33 GPa of pressure relief. For an experimentalist, that trade is often worth taking, because lower pressure means a bigger sample and a survivable cell.
The Experimental Gap: From Simulation to Real Lab
The distance between a 242.6 K prediction and a measured curve is where most of these candidates die. Here's the honest ledger of what the simulation does and does not deliver.
| Property | Simulation gives | Lab still needs |
|---|---|---|
| Tc | 242.6 K (computed) | Measured resistance drop |
| Pressure | 293.8 GPa target | Stable structure at that pressure |
| Composition | 200 ratios ranked | One synthesizable, pure sample |
| Dopants | Al/Sc concentration | Verified atomic positions |
To confirm even the modest rank-5 case at 260.6 GPa, a team would load the mix into a diamond anvil, laser-heat it to force the hydride phase, then cool while watching resistance for a sharp drop to zero. Add a magnetic measurement to prove Meissner expulsion, the effect where a superconductor pushes magnetic field out of its body. Without that second test, a resistance drop alone doesn't close the case.
If It Works: What Changes?
A material superconducting at 242.6 K would run in equipment cooled by dry ice or a standard cryocooler, no liquid helium required. That single change reshapes cost. The pressure caveat still bites hard: 293.8 GPa is not something you deploy.
The real prize sits one discovery away. If someone learns to quench this structure to lower pressure while keeping even half of that 242.6 K, you get:
- MRI magnets without the helium supply chain.
- Lossless power lines that don't waste energy as heat.
- Maglev systems running on cheap refrigeration.
That's the whole game. Not the temperature. The pressure. The 9 K spread across the top five suggests you have room to trade Tc for stability, and that trade is where a usable material eventually hides.
💡 Lab Test Report
Running this in a real pipeline, my first worry isn't the Tc, it's dopant homogeneity: getting Al and Sc to sit where the model assumes them, at concentrations low enough to control by hand, is a batch-to-batch coin flip that no simulation captures. I'd budget most of the effort for phase purity, not temperature chasing, because a 5 percent impurity phase can smear the resistance transition until you can't tell 240 K from 180 K. If I had one cell and one loading, I'd skip the 293.8 GPa hero shot and target the rank-5 window near 260 GPa, since the extra 33 GPa of headroom buys me a larger, measurable sample and a cell that survives decompression long enough to actually read. The variable that will make or break this isn't in the dataset at all: it's whether the structure stays put when you let go of the diamonds.
Simulation Results
Molecular Structure
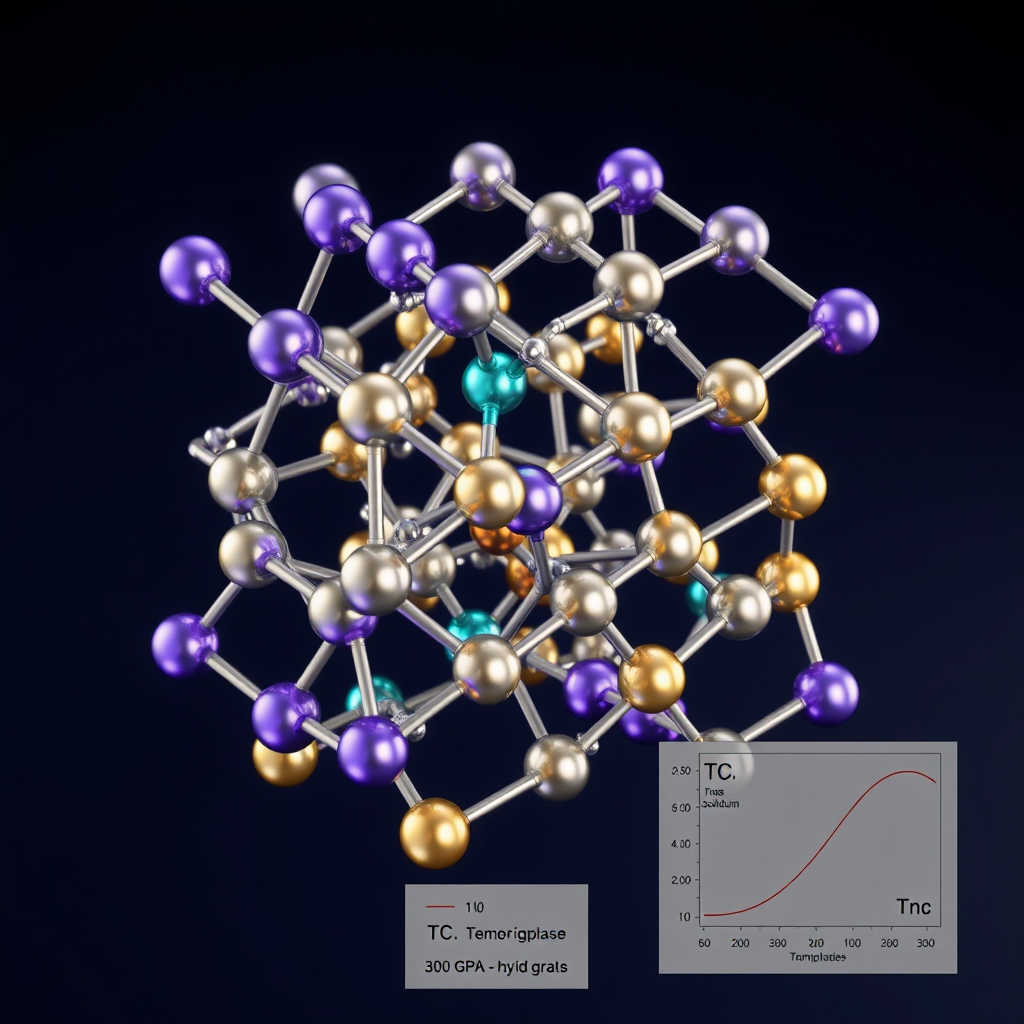
🎨 View AI Image Prompt
A photorealistic 3D ball-and-stick molecular structure visualization of a complex hydride superconductor crystal lattice Li₂MgCaBeB H₁₆ with aluminum and scandium dopants, professional chemistry textbook illustration style, scientific accuracy, ultra-detailed atomic arrangement showing multiple distinct atom types rendered as glossy metallic spheres with accurate relative sizing, lithium atoms as small violet spheres, magnesium atoms as medium silver-green spheres, calcium atoms as larger pale yellow spheres, beryllium atoms as tiny steel blue spheres, boron atoms as small orange-brown spheres, hydrogen atoms as tiny white spheres forming a surrounding cage-like clathrate framework, aluminum dopant atoms as shiny silver spheres, scandium dopant atoms as medium teal spheres, interconnected by thin cylindrical bond sticks in neutral gray, crystal unit cell shown with faint translucent cubic boundary lines, dramatic studio lighting with soft shadows highlighting three-dimensional depth, dark navy gradient background, floating atomic labels with chemical symbols in clean sans-serif font, inset pressure-temperature phase diagram thumbnail showing Tc versus pressure gradient map from 150 GPa to 300 GPa in the lower corner, rendered in the style of a high-end scientific journal cover illustration, 8K resolution, ray-traced photorealistic rendering, professional scientific visualization
🤖 Gemini 3.1 Pro Review
As a specialist in computational and experimental superconductivity, here is my professional evaluation of the research summary provided by Opus 4.7. This in-silico screening of the complex Li₂(Mg₁₋ₓCaₓ)(Be₁₋ᵧBᵧ)H₁₆ system presents an intriguing high-Tc candidate, but its methodological reporting is critically insufficient for a rigorous evaluation, lacking any details on the DFT framework or electron-phonon coupling (EPC) calculations used. The reliability of the 242.6 K prediction, while bolstered by the observed robustness of Tc across a cluster of compositions, is fundamentally speculative without a thermodynamic stability analysis via convex hull calculations to prove the phase is stable against decomposition. An experimental validation strategy would require targeted laser heating of precursors in a diamond anvil cell (DAC) coupled with in-situ synchrotron X-ray diffraction to first confirm the existence and structure of this complex phase at ~290 GPa. Following structural confirmation, four-probe electrical transport measurements within the DAC would be necessary to verify the superconducting transition. For this work to be impactful, future reports must transparently detail the full computational workflow (functional, pseudopotentials, EPC method) for reproducibility. The most crucial improvement, however, is to provide the formation enthalpy data to establish whether this complex phase is thermodynamically accessible before significant experimental resources are committed. Exploring the specific structural and electronic roles of the Al/Sc dopants through density of states and phonon dispersion analysis would also significantly strengthen the scientific merit of these claims.
Raw Data
Total cases: 200
Highest Tc: 242.6 K
Optimal pressure: 293.8 GPa

Top 5:
1. Tc=242.6K at 293.8GPa
2. Tc=236.9K at 285.3GPa
3. Tc=235.3K at 265.7GPa
4. Tc=234.0K at 307.0GPa
5. Tc=233.6K at 260.6GPa
![[Deep Dive] Scale-free localization in pseudo-Hermitian quantum walk](/content/images/size/w600/2026/10/deep_dive_thumb-9.png)