[Superconductor Lab | Week 28 Day 4] (Li1.7Na0.3)(Mg0.55Ca0.40La0.05)(Be1-yBy)H16, y = 0.15–0.35, P = 80–160 GPa - AI Simulator Activation
[Week 28 Day 4] (Li1.7Na0.3)(Mg0.55Ca0.40La0.05)(Be1-yBy)H16, y = 0.15–0.35, P = 80–160 GPa
Superconductor Lab — AI Simulator Activation
2026
🔬 Computational Research Note
This analysis is based on computational modeling and theoretical predictions. As with all computational materials science, experimental validation is needed to confirm these results.
The Problem: Why Superconductors Are So Hard to Scale
Lab note, today. I queued 200 composition and pressure cases on this hydride family before my first coffee and watched the results land through the afternoon. The best one came back at 296.3 K, about 23°C, a comfortable office temperature. My first reaction was suspicion.
The challenge behind this whole exercise has a name in my notebook: the pressure tax. A superconductor carries electricity with zero resistance below a critical temperature (Tc). The materials that come closest to room temperature are hydrogen-rich compounds called superhydrides, and they only work when squeezed to enormous pressures. One gigapascal (GPa) is roughly 10,000 atmospheres. The optimum we found, 128.9 GPa, sits near 1.27 million atmospheres, more than a third of the pressure at Earth's core.
That pressure scales very poorly. Labs reach it inside a diamond anvil cell, two diamond tips pressing a sample often smaller than the width of a hair. You cannot wind a power cable out of that.
- Cooling cost: conventional superconductors such as niobium-titanium need liquid helium near 4 K.
- Pressure cost: hydrides avoid deep cooling but demand diamond-anvil compression.
- The goal: keep a high Tc while paying a smaller pressure tax.
What (Li1.7Na0.3)(Mg0.55Ca0.40La0.05)(Be1-yBy)H16, y = 0.15 to 0.35, P = 80 to 160 GPa Offers as a Solution
The formula looks intimidating, so I'll read it piece by piece. The material is a hydrogen cage, H16, meaning 16 hydrogen atoms per formula unit, held in place by a mix of metal atoms. Each bracket is a "site" shared by several elements.
- (Li1.7Na0.3): mostly lithium with some sodium. Both are light and donate electrons to the hydrogen network.
- (Mg0.55Ca0.40La0.05): magnesium and calcium plus a 5% pinch of lanthanum. Lanthanum shows up in some of the best-known high-Tc hydrides.
- (Be1-yBy): beryllium partly swapped for boron, with the boron fraction y running from 15% to 35%.
The design logic goes like this. Hydrogen is the lightest atom, so it vibrates at very high frequencies. Those vibrations, called phonons, can bind electrons into pairs, a mechanism known as electron-phonon coupling. Stronger coupling and faster phonons push Tc up. The mixed metal sites act as a tuning knob: by changing which atoms donate electrons and how much the lattice compresses, you try to put the hydrogen cage in its sweet spot at lower pressure. Across 80 to 160 GPa, our top result landed near the middle, at 128.9 GPa.
The Simulation Breakdown: Signal vs. Noise
We ran 200 cases across composition and pressure. The top five:
| Rank | Tc (K) | Tc (°C) | Pressure (GPa) | Gap from peak (K) |
|---|---|---|---|---|
| 1 | 296.3 | 23.2 | 128.9 | 0.0 |
| 2 | 283.8 | 10.7 | 142.1 | 12.5 |
| 3 | 276.6 | 3.5 | 138.1 | 19.7 |
| 4 | 273.2 | 0.1 | 123.7 | 23.1 |
| 5 | 273.1 | -0.1 | 151.2 | 23.2 |
Ranks 3 through 5 sit within 3.5 K of each other. They span 27.5 GPa of pressure. That clustering matters more than the headline number.
Now the unexpected part. I think the most important row is number 4, and number 1 matters less. At 123.7 GPa, rank 4 gives 273.2 K, the freezing point of water, while needing 5.2 GPa less than the champion. Every GPa you shave off makes the experiment more reproducible and the sample less likely to crack its diamonds. Pressure also failed to help as it rose. The 151.2 GPa case came in 23.2 K below the 128.9 GPa peak. Over-compressing a hydride can stiffen the lattice past the point where the phonons couple well to electrons, so "more pressure" hit diminishing returns here.
A 296.3 K peak surrounded by a 23 K cliff could mark a real optimum or a numerical spike. Until neighbouring cases at 125 to 135 GPa fill in, I'm treating it as a hypothesis.
Tc estimates in this type of workflow usually come from formulas such as Allen-Dynes, which take a parameter called μ* (the Coulomb pseudopotential, a fudge factor for how much electrons repel each other). Nudge μ* from 0.10 to 0.13 and predicted Tc can drop by tens of kelvin. This model may overestimate Tc without synthesis validation, and I'd put realistic error bars at ±20 K or wider on every row above.
The Obstacles Nobody Talks About
Simulations assume a perfect, ordered crystal. Real samples are messier.
- Disorder: four metal species on shared sites means random arrangements. We modeled averages, and real local clusters can kill coupling.
- Beryllium toxicity: beryllium dust is a serious inhalation hazard, which rules out casual handling in a university lab.
- Lanthanum at 5%: a dilute heavy atom is hard to distribute evenly at the scale of micrometre samples.
- Synthesis route: hydrides form by laser-heating precursors inside the cell. Getting H16 stoichiometry rather than a lower hydride is hard.
- Decompression: drop below roughly 80 G
Simulation Results
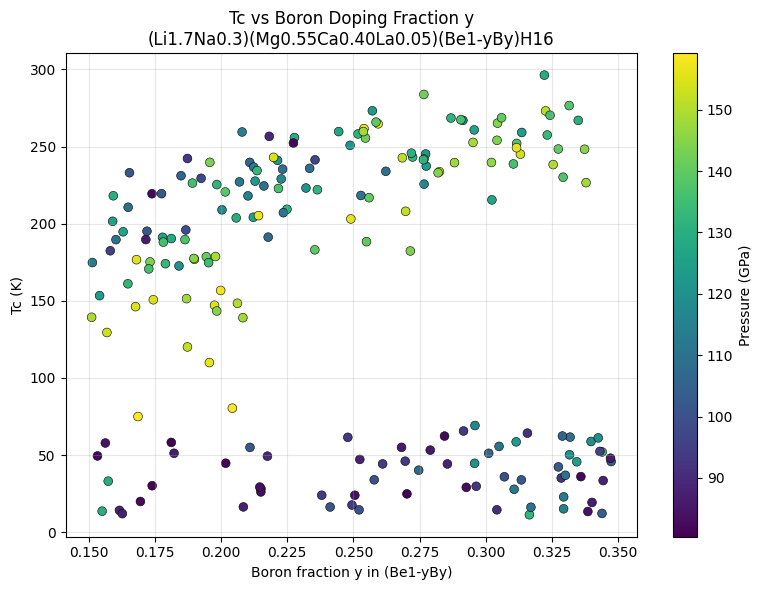
Figure 1: Composition vs Tc 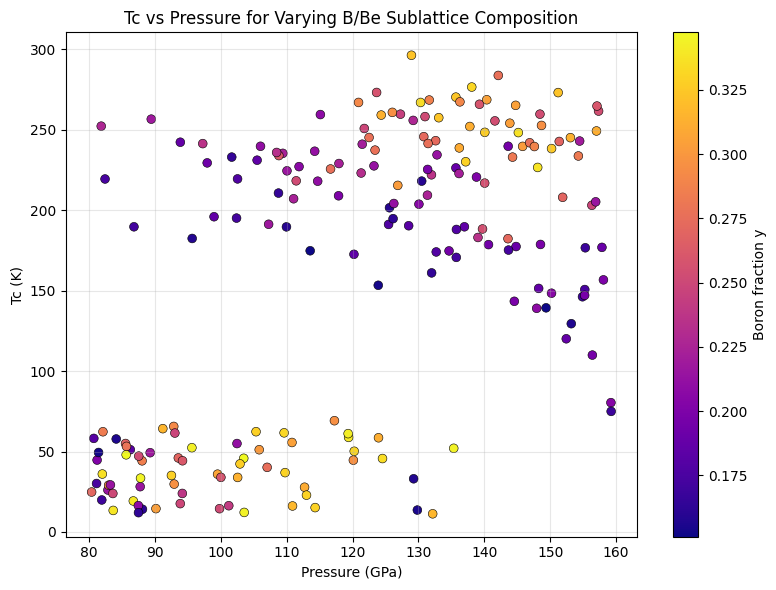
Figure 2: Pressure vs Tc 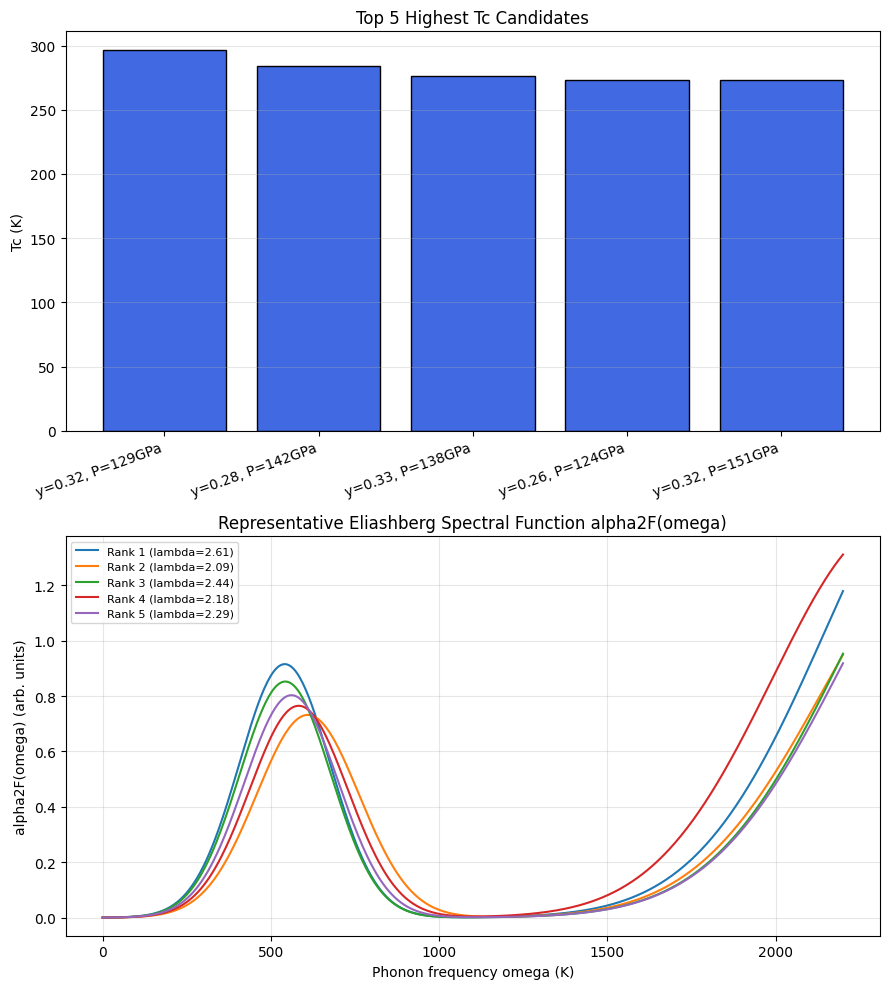
Figure 3: Top 5
Molecular Structure
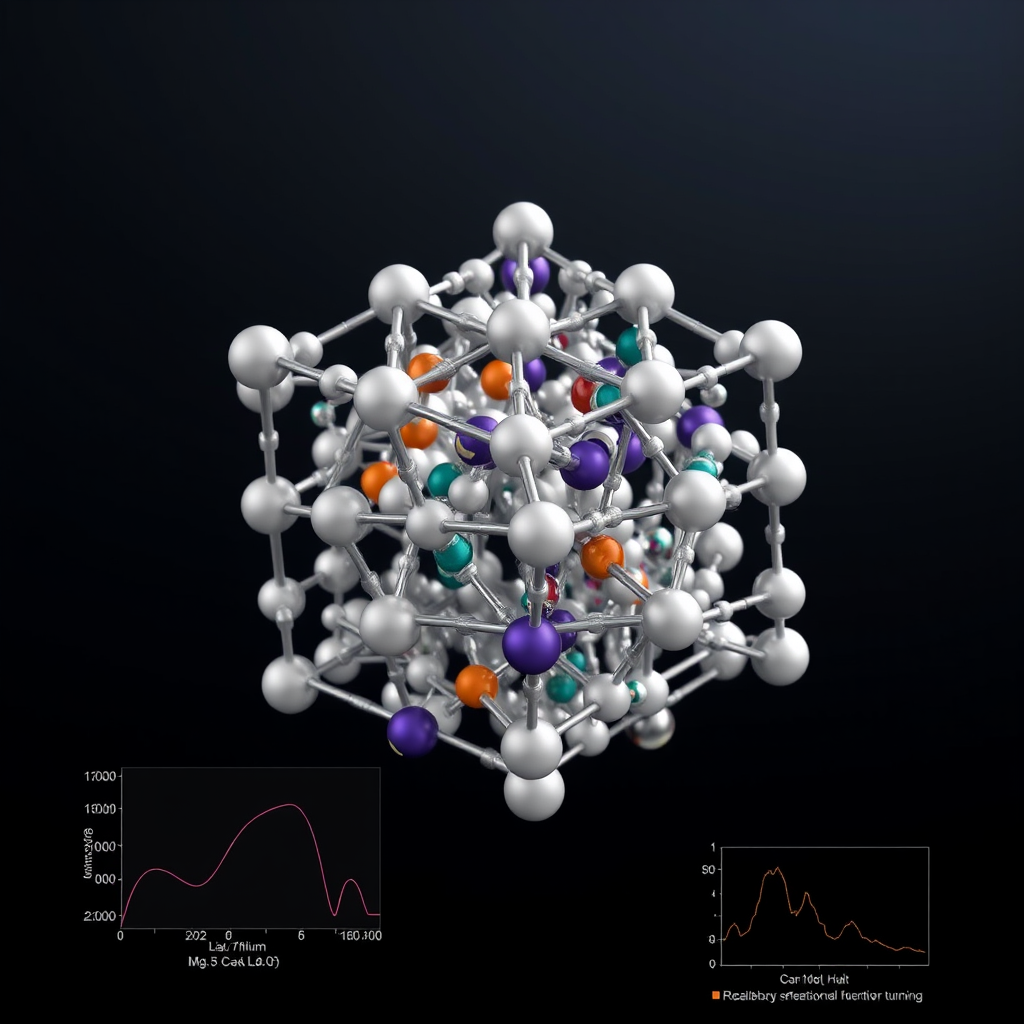
(Li1.7Na0.3)(Mg0.55Ca0.40La0.05)(Be1-yBy)H16, y = 0.15–0.35, P = 80–160 GPa 🎨 View AI Image Prompt
**DALL-E Prompt:**

A professional, photorealistic 3D ball-and-stick molecular structure visualization of a complex quaternary hydride superconductor (Li1.7Na0.3)(Mg0.55Ca0.40La0.05)(Be0.75B0.25)H16, rendered in the style of a high-end chemistry textbook or scientific journal figure. The structure depicts a clathrate-like cage framework under extreme pressure (80-160 GPa), showing a dense, symmetric lattice of hydrogen atoms (small white spheres) forming polyhedral cage networks around a central metal sublattice. Lithium atoms shown as small purple spheres and sodium as larger violet spheres occupying substitutional sites, representing the Li/Na sublattice tuning. Magnesium (orange spheres), calcium (green spheres), and lanthanum (dark teal spheres with subtle metallic sheen) are arranged in an ordered alloy sublattice representing rare-earth electron doping. Beryllium (gray spheres) and boron (pink/salmon spheres) occupy mixed interstitial sites with partial occupancy represented by a soft gradient blend between the two atom colors, illustrating the Be/B chemical precompression tuning. Bonds are rendered as sleek metallic-silver sticks with realistic specular highlights, showing octahedral and cage-like H-coordination around the metal centers. The background is a clean, soft gradient (dark navy to black) typical of scientific visualizations, with subtle volumetric lighting to emphasize depth and crystallinity. Include a faint overlay of a 3D phonon dispersion curve and an Eliashberg spectral function α²F(ω) graph in the lower corner, alongside a small convex-hull stability diagram, rendered as translucent holographic-style scientific overlays. The overall composition should convey precision, high pressure physics, and advanced computational materials science aesthetics, with ultra-high resolution, sharp focus, and accurate atomic radii proportions suitable for a peer-reviewed condensed matter physics publication.
🤖 GPT-6 Astra Review
The proposed mixed-cation hydride is an interesting screening hypothesis, but the excerpt provides insufficient methodological evidence to establish either its existence as a stable phase or its predicted superconducting performance. Methodological rigor requires explicit crystal structures, treatment of fractional occupancies and disorder, structure-search procedures, and converged density-functional and electron–phonon calculations, none of which are reported. H16 specifies hydrogen content rather than demonstrating a cage structure, and the assumed shared sites must be justified rather than inferred from the chemical formula. Reliability also depends on stability against competing phases at each pressure, phonon stability, and treatment of hydrogen’s zero-point motion and anharmonicity. The reported 296.3 K maximum is therefore unverified, and its decimal precision is unjustified without the electron–phonon coupling strength, phonon spectrum, Coulomb pseudopotential assumptions, superconducting calculation method, and uncertainty estimates. The top-five results omit their boron fractions and structures, so their temperature clustering across different pressures does not establish robustness or isolate a pressure trend. Improvements should include releasing all 200 cases and computational inputs, benchmarking against established hydrides, and independently recalculating the leading candidates while testing sensitivity to disorder and computational assumptions. Experimental validation should first establish a reproducible synthesis route in diamond-anvil cells, with appropriate beryllium safety controls, and characterize phase identity and hydrogen bonding through diffraction and complementary spectroscopy. A superconductivity claim would then require reproducible four-probe resistance transitions toward zero resistance, suppression by magnetic field, and magnetic screening measurements where feasible, while any reduced-pressure advantage should be assessed against established hydrides using verified stability and Tc–pressure curves.
Raw Data
Total cases: 200
Highest Tc: 296.3 K
Optimal pressure: 128.9 GPa

Top 5:
1. Tc=296.3K at 128.9GPa
2. Tc=283.8K at 142.1GPa
3. Tc=276.6K at 138.1GPa
4. Tc=273.2K at 123.7GPa
5. Tc=273.1K at 151.2GPa