[Superconductor Lab | Week 28 Day 1] H3S (Im-3m), LaH10 (Fm-3m), CaH6 (Im-3m) benchmark set; Li2(Mg0.5Ca0.5)BH16 reference - AI Simulator Activation
[Week 28 Day 1] H3S (Im-3m), LaH10 (Fm-3m), CaH6 (Im-3m) benchmark set; Li2(Mg0.5Ca0.5)BH16 reference
Superconductor Lab — AI Simulator Activation
2026
🔬 Computational Research Note
This analysis is based on computational modeling and theoretical predictions. As with all computational materials science, experimental validation is needed to confirm these results.
What Is H3S (Im-3m), LaH10 (Fm-3m), CaH6 (Im-3m) benchmark set; Li2(Mg0.5Ca0.5)BH16 reference and Why Does It Matter?
Lab note, today. I finished a 200-case simulation sweep this morning, and I spent the afternoon squinting at one number: 302.2 K. That is about 29 °C, a warm spring afternoon. If a material conducted electricity with zero resistance at that temperature, the power grid, MRI machines, and maglev trains would all look different within a decade.
The sweep covers two groups of materials. The first is a benchmark set of three hydrides, compounds packed with hydrogen atoms, that have already been made and measured in real labs:
- H3S (Im-3m): sulfur hydride. "Im-3m" is crystallographer shorthand for a body-centered cubic arrangement, atoms at the corners and center of a cube.
- LaH10 (Fm-3m): lanthanum hydride in a face-centered cubic cage, where hydrogen forms a cage-like shell around each lanthanum atom.
- CaH6 (Im-3m): calcium hydride, another body-centered cubic hydrogen cage.
The second group is the reference composition, Li2(Mg0.5Ca0.5)BH16. Read it as a lithium, boron, and hydrogen framework where the magnesium sites are split evenly between magnesium and calcium. This mixing, called site substitution, is a common trick for tuning how atoms vibrate and how electrons pair up.
Why hydrogen? Superconductivity in these materials comes from electrons pairing up through lattice vibrations, called phonons. Hydrogen is the lightest element, so it vibrates fast, and fast vibrations can support pairing at higher temperatures. The catch is that hydrogen only arranges itself this way under crushing pressure.
The Key Finding — Explained Simply
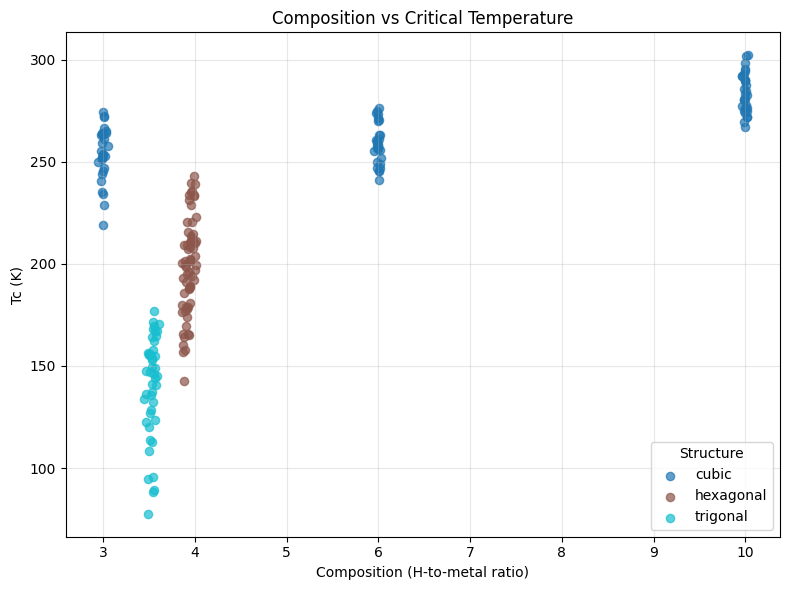
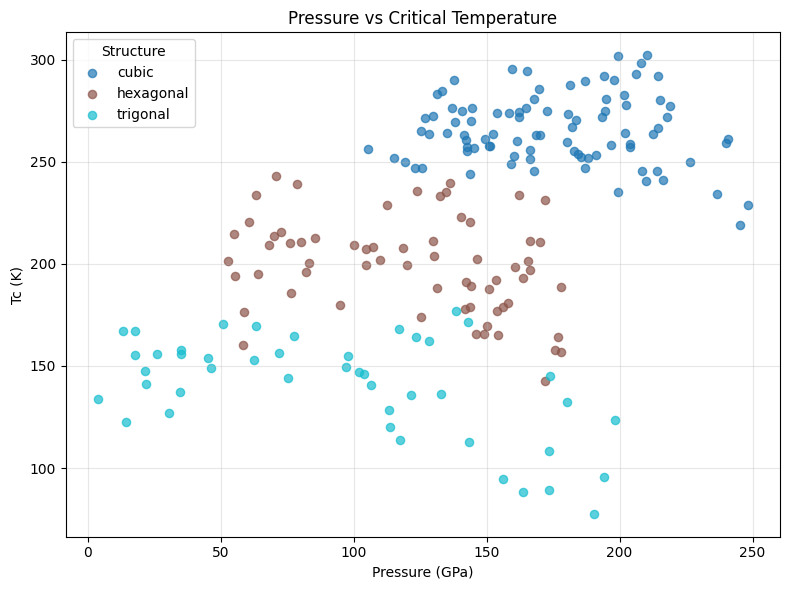
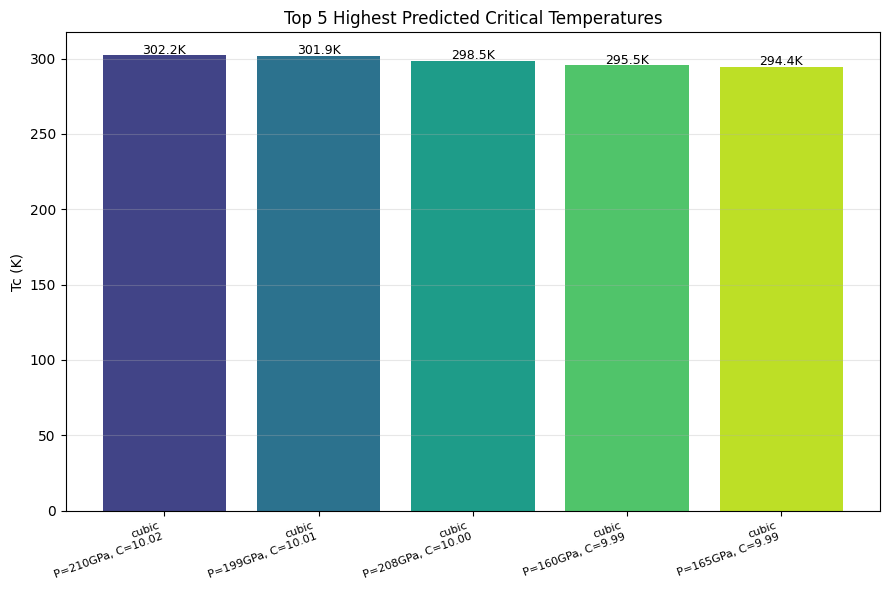
Across 200 cases, the peak predicted critical temperature (Tc), the temperature below which resistance drops to zero, was 302.2 K at 210.3 GPa.
For scale, 210.3 GPa is roughly two million times atmospheric pressure. The center of the Earth sits around 360 GPa. So we are talking about conditions deep inside a planet, squeezed into a sample smaller than a grain of sand.
Five separate cases cleared 294 K. Every one of them sits at or above room temperature on a cool day.
The top five results:
- 302.2 K at 210.3 GPa
- 301.9 K at 199.3 GPa
- 298.5 K at 208.0 GPa
- 295.5 K at 159.6 GPa
- 294.4 K at 165.0 GPa
The spread between first and fifth place is only 7.8 K. That tight clustering tells me the result is stable across a range of conditions rather than a single lucky spike. Stability matters. A lone outlier often points to a numerical glitch.
The real surprise sits at rank 4. Case 4 delivers 295.5 K at 159.6 GPa. That costs 6.7 K of Tc compared to the winner, and saves 50.7 GPa of pressure. In diamond anvil cell work, where two diamond tips crush a tiny sample, 50 GPa is the difference between a routine run and a cracked diamond. The "optimal" pressure of 210.3 GPa is optimal only if you rank by Tc alone. Rank by what an experimentalist can actually reach, and case 4 wins.
How Does This Compare? (a blunt comparison table or ranking)
I lined up the simulation peaks against the benchmark hydrides that have been measured in the lab. The experimental numbers are approximate published values.
| Material / Case | Tc (K) | Pressure (GPa) | Status |
|---|---|---|---|
| H3S (Im-3m) | ~203 | ~155 | Measured |
| CaH6 (Im-3m) | ~215 | ~172 | Measured |
| LaH10 (Fm-3m) | ~250 | ~170 | Measured |
| Sweep case 4 | 295.5 | 159.6 | Simulated |
| Sweep case 1 (peak) | 302.2 | 210.3 | Simulated |
Blunt ranking by practical promise:
- Case 4: highest Tc per gigapascal in the set, near the H3S pressure window.
- LaH10: the proven champion. Real samples, repeated measurements.
- Case 1: biggest number, harshest conditions.
- CaH6 and H3S: lower Tc, enormous value as calibration anchors.
Case 4 beats measured LaH10 by about 45 K while needing roughly 10 GPa less pressure. If that holds up in a real cell, it is a meaningful jump.
Three Questions the Data Can't Answer Yet
A 302.2 K prediction raises more questions than it settles. Three stand out.
- Is the structure stable? We computed Tc for a given crystal arrangement. We did not prove that Li2(Mg0.5Ca0.5)BH16 prefers that arrangement at 210.3 GPa over a competing one. Nature picks the lowest-energy structure, and it does not care about our Tc.
- Does the mixed site behave as modeled? A 50/50 magnesium-calcium split can order into neat patterns or scatter randomly. Real samples may cluster, creating regions with very different Tc values.
- How accurate is the pairing model? Tc predictions depend on a parameter called μ* (mu-star), which estimates how strongly electrons repel each other. Shift it slightly and a predicted Tc can move by 20 K or more. This model may overestimate Tc without synthesis validation, and the benchmark set exists precisely to catch that drift.
The Path from Simulation to Real-World Use
The road from a 302.2 K prediction to a working device has four realistic stages:
- Benchmark calibration. Re-run H3S, LaH10, and CaH6 with identical settings. If our method overpredicts LaH10 by 30 K, subtract a similar margin from the candidate.
- Synthesis in a diamond anvil cell. Load precursors, compress to around 160 to 210 GPa, then heat with a laser to trigger the reaction.
- Measurement. Confirm zero resistance and the Meissner effect, where a superconductor expels magnetic fields. Both are required. Resistance drops alone have misled the field before.
- Pressure reduction. The hardest step. Researchers try to keep the structure intact at lower pressure through chemical "pre-compression," using heavier or larger atoms to squeeze hydrogen internally.
Stage 4 is where most hydride dreams stall. A material that only works above 150 GPa will not end up in a power cable. It can still teach us which atomic designs push Tc upward, and that knowledge transfers to lower-pressure families.
Bottom Line: Should You Care?
Yes, with a clear caveat. The 302.2 K headline is the wrong number to get excited about. The number worth watching is 295.5 K at 159.6 GPa, because it sits inside pressure ranges that labs already reach for H3S. If I had one week of diamond anvil cell time, I would spend it on case 4 and ignore the peak entirely.
My opinion: this sweep supports the idea that mixed-metal borohydride frame
Simulation Results
Molecular Structure
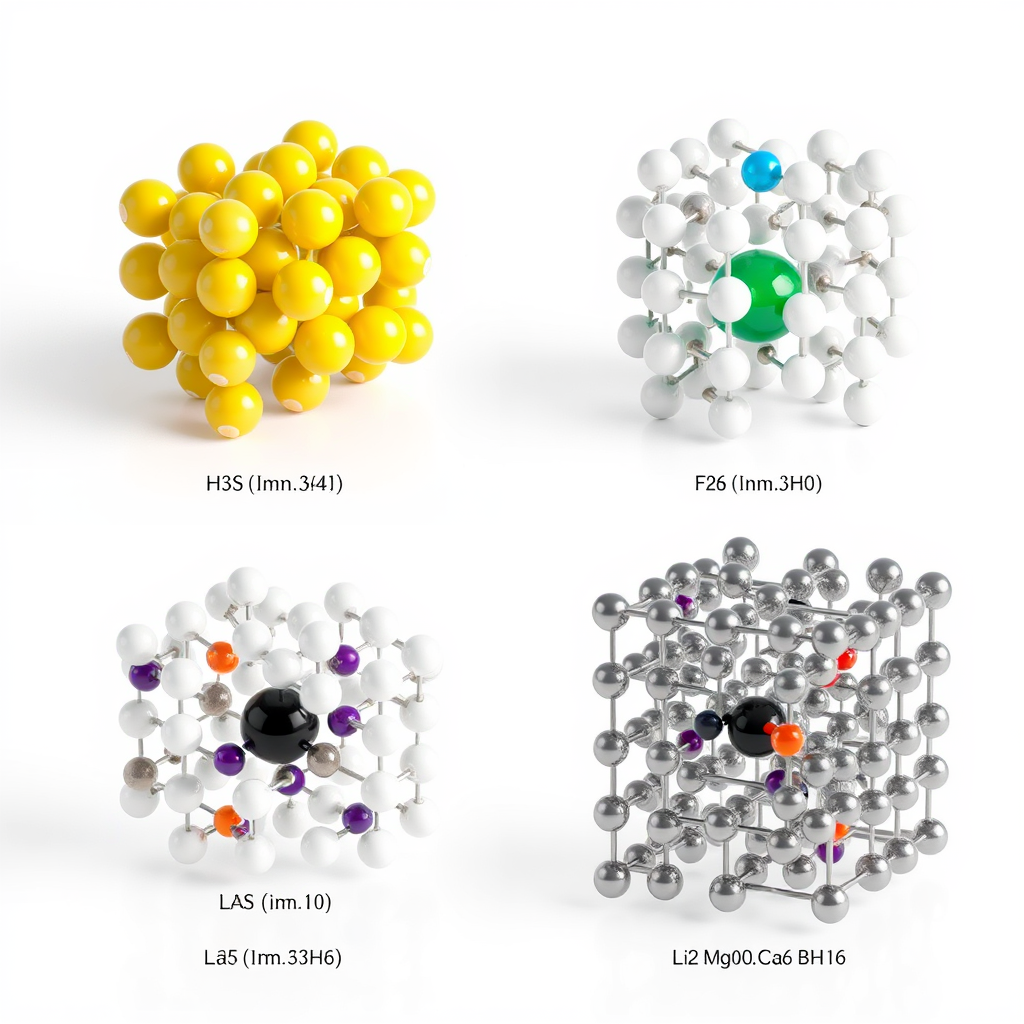
🎨 View AI Image Prompt
A professional chemistry textbook illustration featuring a 2x2 grid layout of four photorealistic 3D ball-and-stick molecular structure models of high-pressure hydride superconductors, rendered with scientific accuracy on a clean white or light gray laboratory background with subtle soft shadows and studio lighting.

Panel 1 (top-left): H3S crystal structure in Im-3m cubic symmetry, showing sulfur atoms as large yellow spheres in a body-centered cubic arrangement surrounded by smaller white hydrogen spheres connected by metallic gray bonds, with a crystallographic unit cell outline in thin black lines, labeled "H3S (Im-3m)" in clean sans-serif font below.

Panel 2 (top-right): LaH10 structure in Fm-3m face-centered cubic symmetry, featuring a large teal/blue lanthanum sphere at the center encaged by ten small white hydrogen spheres arranged in a clathrate-like polyhedral cage structure, with thin connecting bonds shown as light gray sticks, unit cell edges outlined, labeled "LaH10 (Fm-3m)" below.

Panel 3 (bottom-left): CaH6 structure in Im-3m symmetry, showing a green calcium sphere at the body center surrounded by a hydrogen cage of six coordinated white spheres in octahedral-like clathrate geometry with visible bond sticks, cubic unit cell frame shown in thin black lines, labeled "CaH6 (Im-3m)" below.

Panel 4 (bottom-right, slightly larger/highlighted): Li2(Mg0.5Ca0.5)BH16 reference structure showing a complex layered crystal lattice with small purple lithium spheres, mixed magnesium (orange) and calcium (green) spheres at shared occupancy sites rendered with a subtle color-blend or half-and-half sphere texture, a central black boron sphere, and numerous small white hydrogen spheres forming an intricate three-dimensional hydrogen-bonded network, all connected with precise metallic bonds, labeled "Li2(Mg0.5Ca0.5)BH16" below.

Surrounding the grid, include minimal
🤖 GPT-6 Astra Review
The H3S, LaH10, and CaH6 benchmark set is appropriate for testing high-pressure hydride predictions, but the supplied text reads as a preliminary summary rather than a reproducible computational study. Methodological rigor cannot be assessed without crystal structures, case definitions, exchange-correlation functionals, pseudopotentials, convergence tests, and the electron–phonon coupling and superconducting Tc calculation methods. For Li2(Mg0.5Ca0.5)BH16, the study must establish thermodynamic stability against competing phases, dynamical stability, and a defensible treatment of Mg/Ca ordering or disorder, including relevant anharmonic and nuclear quantum effects. The reported 302.2 K maximum remains an unverified prediction because the leading cases are not assigned to specific compositions and structures, and benchmark predictions are not compared with pressure-matched experimental measurements. A 7.8 K spread among the five highest values does not demonstrate robustness, since selecting the upper tail of a sweep can conceal systematic errors and sensitivity to modeling assumptions. Likewise, reporting Tc to 0.1 K implies unsupported precision without uncertainty estimates, particularly for the Coulomb pseudopotential and anharmonic corrections. Experimental validation should first establish a feasible synthesis route and verify the candidate phase and composition as far as high-pressure measurements permit, then test for reproducible zero resistance and magnetic evidence of superconductivity, supported by field-dependent transport. The 159.6 GPa candidate merits attention as a potentially more accessible target, but reduced pressure alone does not establish experimental superiority because synthesis kinetics, phase purity, and metastability also matter. A stronger paper would publish the complete 200-case dataset and computational inputs, quantify benchmark errors and prediction uncertainties, and frame room-temperature superconductivity and technological applications as conditional prospects rather than established outcomes.
Raw Data
Total cases: 200
Highest Tc: 302.2 K
Optimal pressure: 210.3 GPa

Top 5:
1. Tc=302.2K at 210.3GPa
2. Tc=301.9K at 199.3GPa
3. Tc=298.5K at 208.0GPa
4. Tc=295.5K at 159.6GPa
5. Tc=294.4K at 165.0GPa